How to Manage 500+ Amazon ASINs Without Losing Control
At 50 ASINs, you can eyeball your business. At 500, Seller Central becomes your enemy. This operational playbook covers the daily, weekly, and monthly rhythm for managing large Amazon catalogs.
At 50 ASINs, you can eyeball your business. At 500, Seller Central becomes your enemy. Report downloads cap out at 10,000 rows. Cross-ASIN filtering doesn't exist. Data arrives 24-48 hours late. At larger catalog sizes, use the operating approaches below to reduce manual review.
This isn't a theoretical problem. Marketplace Pulse data shows that 62% of Amazon units now come from third-party sellers1, and the sellers winning at scale aren't working harder. They're working with better systems. A 50-product seller can check each ASIN manually every morning. A 500-product seller who tries the same approach will spend 4 hours before making a single decision.
This guide is the operational playbook for running a large Amazon catalog without drowning in tabs, spreadsheets, and stale reports. You'll learn the three breakpoints where sellers hit walls, the daily operating rhythm that top sellers use, and the five systems that actually scale.
TL;DR - Key Takeaways
•Seller Central's reporting breaks down around 200 ASINs due to download caps, timeout errors, and 24-48 hour data lag.
•Large catalog management requires three operating rhythms: daily monitoring (Products Feed), weekly analysis (Winners and Losers), and monthly strategy (Custom Breakdowns).
•The five systems that scale are: naming conventions, tagging taxonomy, alert thresholds, delegation frameworks, and reporting cadence.
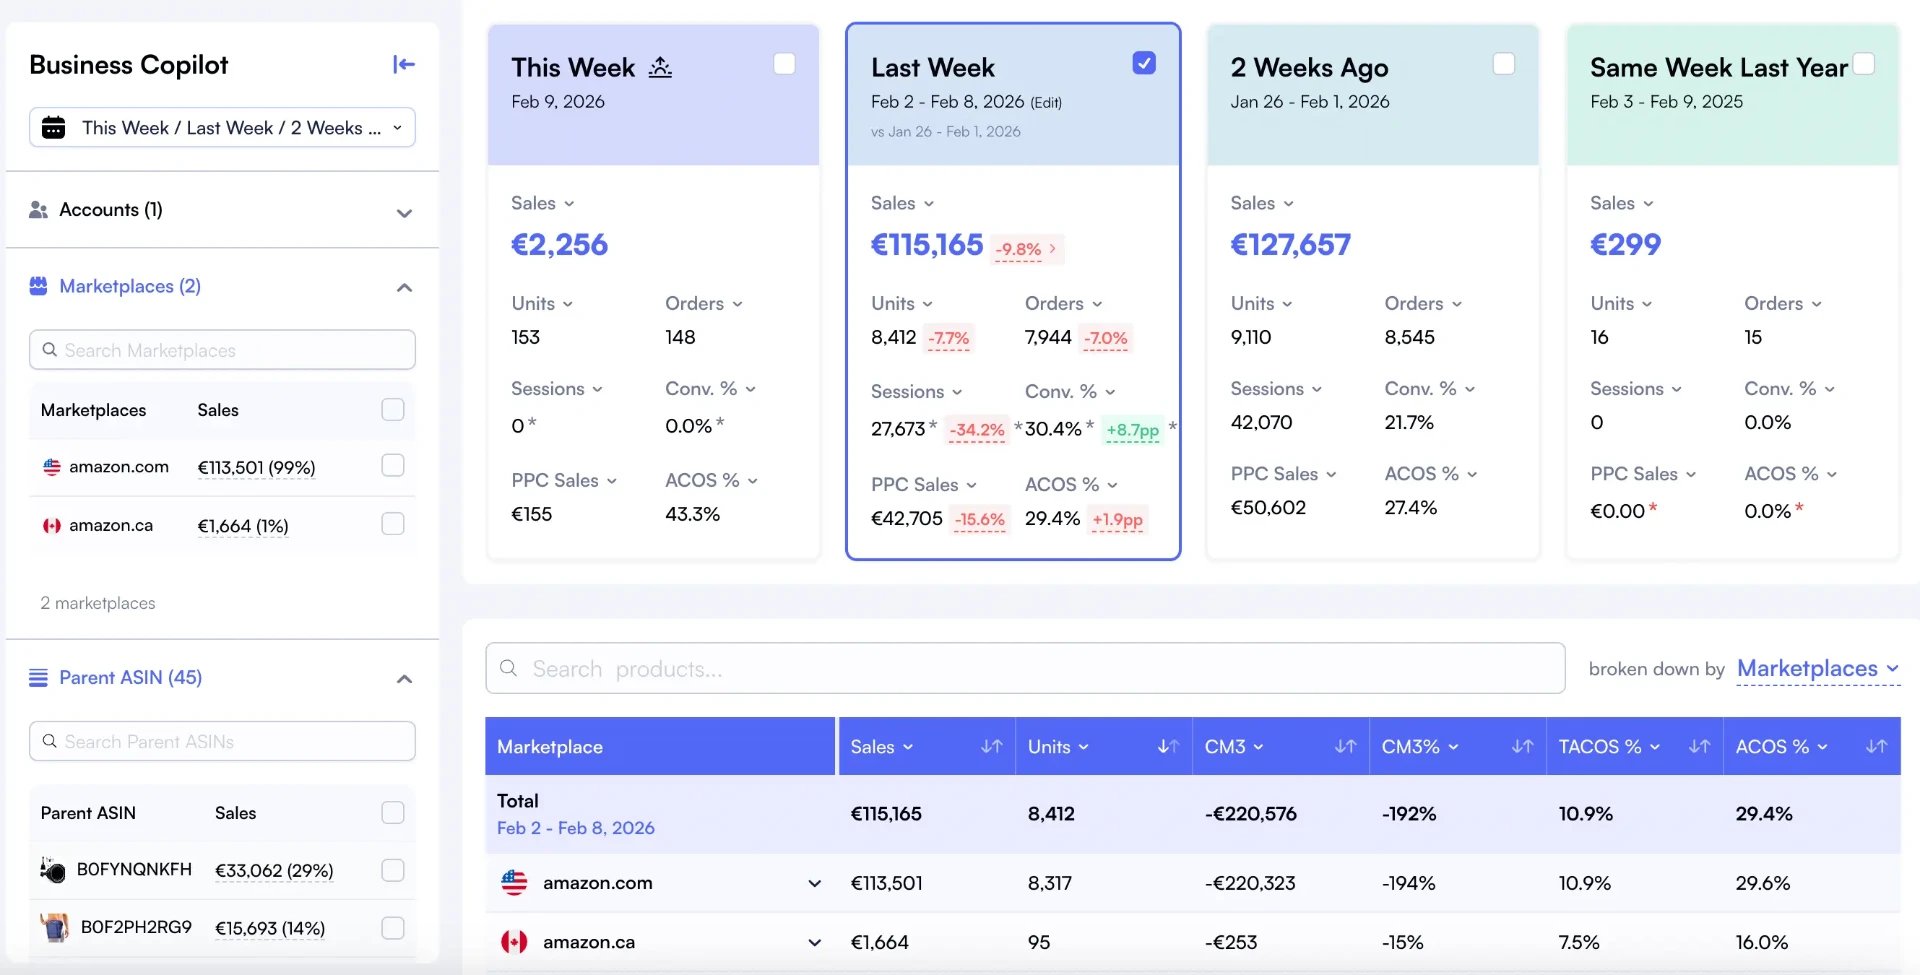
•Nova replaces the 7-tab Seller Central workflow with a single cockpit that receives orders and units in real time across every marketplace.
The Three Breakpoints: Where Amazon Sellers Hit Walls
Not all catalog sizes are created equal. The challenges you face at 80 ASINs are fundamentally different from the challenges at 400. Understanding these breakpoints helps you invest in the right infrastructure at the right time, instead of scrambling when things break.
At this stage, most sellers manage profitability in Google Sheets or Excel. You download Business Reports from Seller Central, paste them into your tracker, manually add COGS, and calculate margins. It works, sort of. But you're already spending 3-5 hours per week on data entry instead of strategy.
The real danger here isn't the time cost. It's the accuracy cost. Manual data entry introduces errors. One wrong COGS figure throws off your entire margin calculation for that product. And because you're looking at data that's 2-3 days old by the time you finish your spreadsheet, you're reacting to problems that have already compounded.
Breakpoint 2: 200-500 ASINs (Seller Central Becomes Unusable)
This is where most scaling sellers hit a genuine crisis. Seller Central was designed for sellers with a handful of products. At 200+ ASINs, you'll encounter:
Download limits: Business Reports cap at 10,000 rows. With multiple marketplaces and date ranges, you hit this wall fast.
Timeout errors: Custom date range reports for large catalogs frequently time out, forcing you to pull data in smaller batches.
No cross-ASIN filtering: you can't filter by supplier, brand, lifecycle stage, or any dimension that matters to your business. Amazon gives you product-level data. You need portfolio-level insight.
48-hour data lag: by the time you see a problem in Seller Central, it's already been bleeding margin for two days.
Seller Central Report Cap
10K
Maximum rows per report download
Typical Data Delay
24-48h
Before data appears in Seller Central
Nova Data Refresh
in real time
Near real-time updates across all ASINs
Breakpoint 3: 500+ ASINs (You Need Infrastructure, Not Tools)
At 500+ ASINs, the problem shifts from "I need better reports" to "I need an operating system." Individual product monitoring is impossible. You need exception-based management: a system that surfaces the 15 products requiring your attention out of 500, without you having to scan through all of them.
This is where the gap between top sellers and everyone else widens dramatically. McKinsey research shows that companies using data-driven decision making are 23x more likely to acquire customers and 6x more likely to retain them2. In the Amazon context, this translates to sellers who can spot a margin decline on Tuesday and fix it by Wednesday, versus sellers who discover the same problem two weeks later in a monthly spreadsheet review.
The Daily Operating Rhythm for Large Catalogs
Top sellers don't try to look at everything every day. They run a tiered review cadence that matches their attention to the urgency of each decision. Here's the rhythm that works for catalogs of 200+ ASINs.
Morning Check: Products Feed Cockpit (15 Minutes)
Your morning starts with exception monitoring. Instead of scanning 500 products, you're looking at the 10-20 that crossed an alert threshold overnight. What you're watching for:
Stockout alerts: Products dropping below 14 days of inventory need reorder decisions today.
Margin drops: any product where contribution margin fell more than 5 percentage points in the last 7 days.
Return spikes: Products with return rates climbing above your category average (typically 8-12% for most categories).
BSR movements: Sudden BSR drops (50%+ in 48 hours) that signal a listing suppression, negative review, or competitor price war.
Nova's Products Feed serves as this cockpit. You set your thresholds once, and the dashboard surfaces only the products that need attention. Fifteen minutes of focused exception monitoring replaces the 2-hour tab-switching marathon that Seller Central demands.
Midday Review: Winners and Losers (10 Minutes)
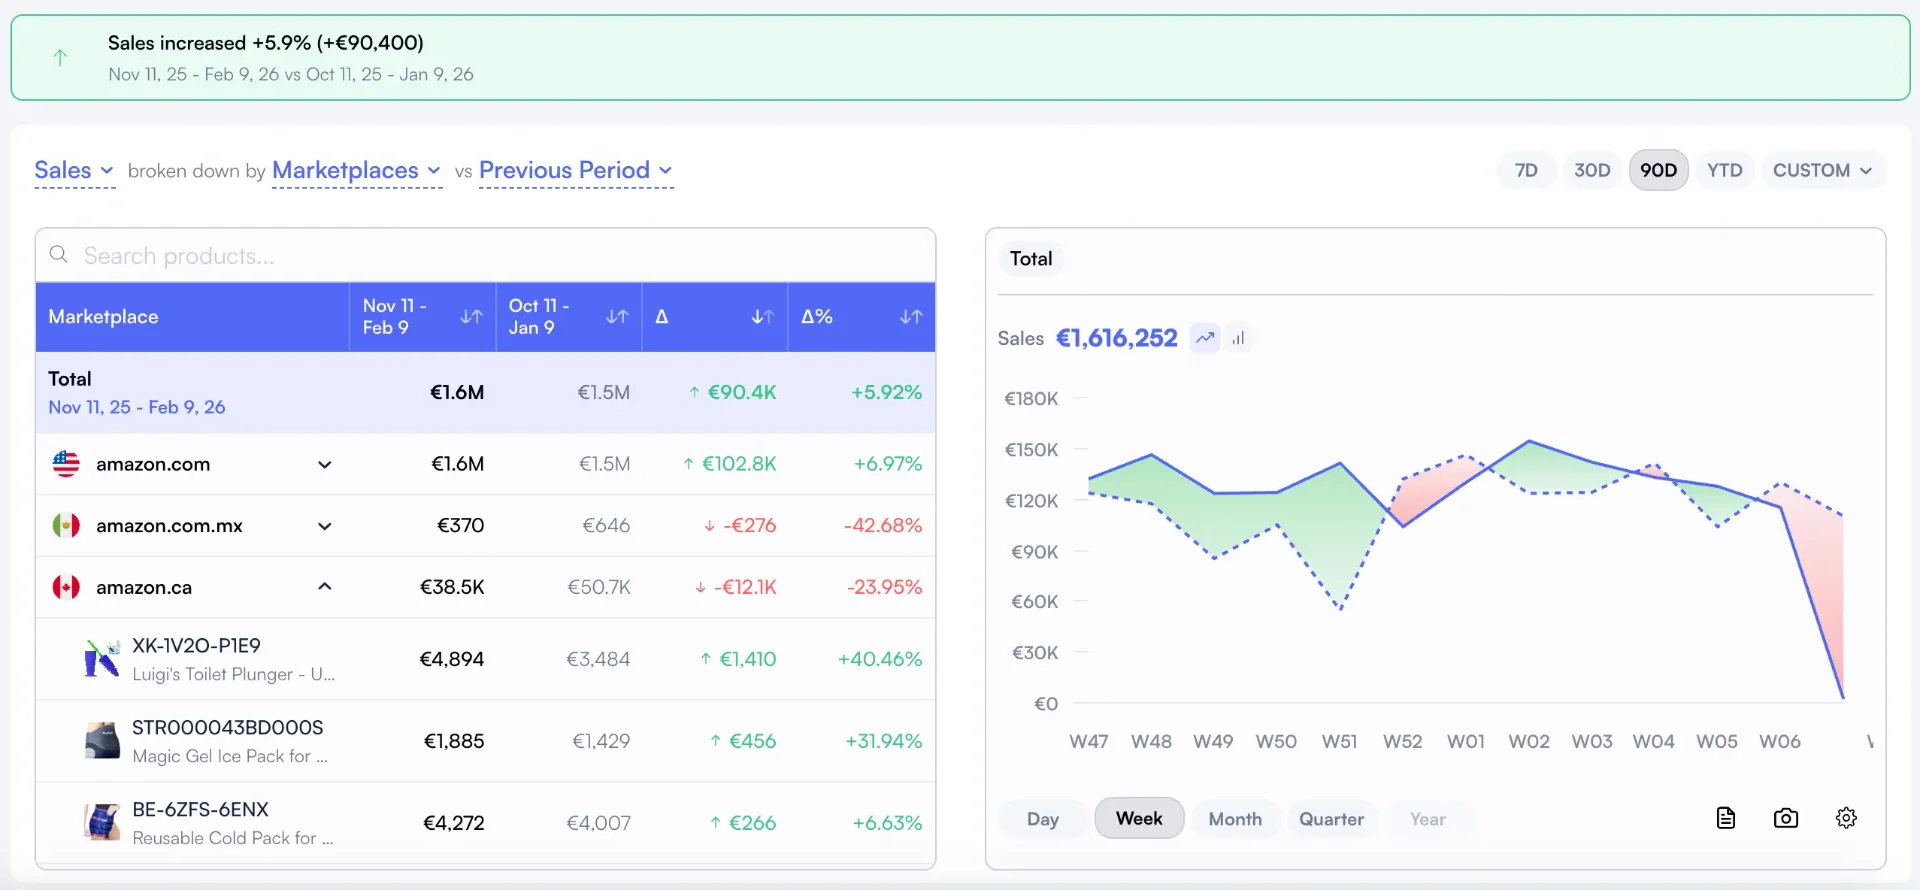
Around midday, you shift from defense (exception monitoring) to offense (trend detection). The Winners and Losers view shows which products are trending up or down across key metrics: revenue, units, margin, and organic share.
This is where you catch opportunities before they mature and problems before they compound. A product that's been gaining 15% more units week-over-week for three consecutive weeks might deserve increased ad spend or a price test. A product with declining organic share and rising TACoS is headed for trouble and needs intervention now, not next month.
Weekly Analysis: Custom Breakdowns (30 Minutes)
Once a week, you zoom out from individual products to portfolio segments. This is where Custom Breakdowns become essential. Instead of analyzing 500 products individually, you're looking at 8-12 segments that map to how you actually think about your business.
Common segmentation dimensions for large catalogs include:
Lifecycle stage: Launch (0-90 days), Growth (90-365 days), Mature (1-3 years), Decline (3+ years or negative trend)
Brand or product line: If you run multiple brands, each one needs its own P&L view
Supplier: Understanding which suppliers deliver the best margins after all Amazon fees
Price tier: Products under $15 face fundamentally different economics than products over $50
Ad dependency: High organic share (over 70%) vs. Ad-dependent (under 40% organic)
The weekly review answers portfolio-level questions: "Is my launch cohort on track?" "Which supplier's products are underperforming?" "Are my premium products maintaining margin, or are competitors forcing price erosion?"
Monthly Strategy: Contribution Margin and SKU Rationalization (2 Hours)
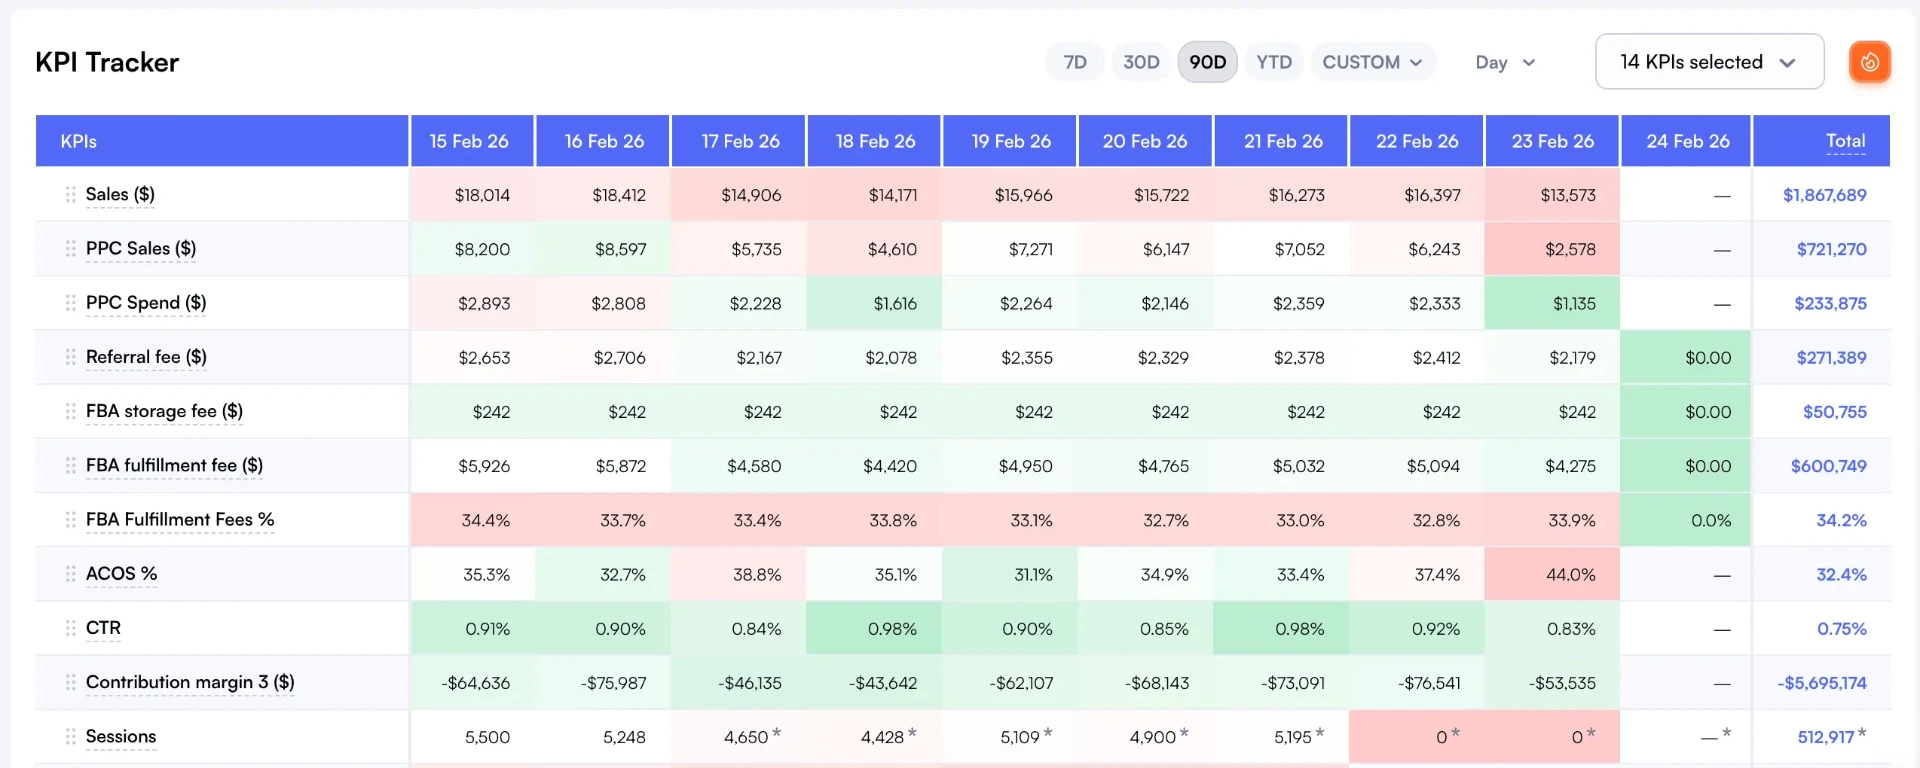
The monthly review is where you make keep, grow, fix, or kill decisions. Using Nova's Custom P&L, you calculate true contribution margin for every product after all fees, COGS, ad spend, and variable costs. Then you rank and sort.
This is where most sellers find surprises. The product you thought was your #3 best seller might actually be #15 by profit contribution once you account for high return rates and heavy ad dependency. Conversely, a quiet mid-catalog product with strong organic sales and low returns might be delivering 3x the margin of your "top sellers."
Operating rhythms are only as good as the systems that support them. Here are the five foundational systems every large catalog seller needs.
1. SKU Naming Conventions
At 50 ASINs, you remember what each product is. At 500, you need a naming system that encodes key information into the SKU itself. A strong convention includes: brand code, category, size/variant, and marketplace. Example: HC-KIT-LG-US (HomeClean brand, Kitchen category, Large variant, US marketplace).
This matters because when you're scanning a P&L report with 500 rows, recognizable SKU names let you spot patterns instantly without clicking into each product. It also makes delegation easier: you can tell a VA "audit all HC-KIT SKUs" without ambiguity.
2. Tagging Taxonomy
SKU names encode permanent attributes. Tags encode dynamic ones. A product might be tagged as "Q1 Launch," "Supplier Alpha," "Premium Tier," and "High Organic" simultaneously. These tags power your weekly Custom Breakdown analysis.
The key is building your taxonomy before you need it. Start with 4-6 dimensions (lifecycle, supplier, price tier, brand, ad strategy, margin tier) and tag your entire catalog in one session. For implementation details, see our product tagging strategies guide.
3. Alert Thresholds (When to Act vs. When to Wait)
Not every metric movement requires action. Good thresholds distinguish noise from signal. Recommended starting points:
Metric
Alert Threshold
Action
Inventory days
Below 14 days
Trigger reorder immediately
Contribution margin drop
5+ points in 7 days
Investigate cause (fee change, price war, COGS increase)
Return rate
Above 12% (category dependent)
Review listing accuracy and product quality
TACoS increase
3+ points in 14 days
Check organic share trend. If organic is declining, fix listing. If stable, adjust ad bids.
BSR drop
50%+ in 48 hours
Check for listing suppression, negative reviews, or stock issues
4. Delegation Frameworks
At 500+ ASINs, you can't do everything yourself. The key is knowing which tasks can be delegated to VAs (virtual assistants) or team members, and which need your strategic judgment:
Delegate: Inventory monitoring against thresholds, listing content updates, routine PPC bid adjustments within defined parameters, customer message responses
The operating rhythm described above naturally supports delegation. Your VAs handle the daily cockpit monitoring (flag anything crossing a threshold). You handle the weekly and monthly strategic reviews.
5. Reporting Cadence by Catalog Size
Catalog Size
Daily
Weekly
Monthly
50-100 ASINs
Scan all products (20 min)
P&L review by product
Full catalog margin analysis
200-500 ASINs
Exception monitoring (15 min)
Segment analysis (6-8 groups)
SKU rationalization + segment review
500+ ASINs
Cockpit alerts only (10 min)
Portfolio breakdown (10-15 segments)
Deep P&L + kill/grow decisions + supplier review
Managing 500 ASINs: Seller Central vs. Spreadsheets vs. Nova
Here's a direct comparison of the three approaches sellers typically use to manage large catalogs, and where each one breaks down.
Capability
Seller Central
Spreadsheets
Nova
Data freshness
24-48 hours
Depends on download frequency
in real time for orders and units
Custom segmentation
Not available
Manual pivot tables
Unlimited custom tags and breakdowns
True P&L per SKU
No (revenue only)
Possible but error-prone
Automated with 99.9% accuracy
Multi-marketplace
Separate accounts
Manual consolidation
Unified dashboard, auto currency conversion
Setup time
None (built in)
20-40 hours initial build
Connect accounts, tag products (1-2 hours)
Weekly maintenance
4-6 hours downloading and merging
3-5 hours updating and fixing
Zero (automated refresh)
Exception-based alerts
Limited to stock alerts
Conditional formatting (manual)
Configurable thresholds across all KPIs
Scales to 1,000+ ASINs
No
Breaks down
Yes
The spreadsheet approach works until it doesn't. And the moment it breaks (usually around 200-300 ASINs), you lose weeks rebuilding systems under pressure while your business runs on stale data. That's why more sellers are moving to purpose-built analytics platforms before they hit the wall, not after.
Common questions about managing hundreds of Amazon products
Amazon doesn't impose a hard cap on the number of ASINs a single seller account can list. Professional sellers regularly manage 1,000+ ASINs across multiple categories. The practical limit isn't Amazon's rules. It's your ability to monitor profitability, inventory, and advertising at that scale. Most sellers hit operational ceilings between 200-500 ASINs without proper analytics infrastructure.
The most effective approach is a multi-dimensional tagging system rather than relying solely on Amazon's product categories. Group products by lifecycle stage (launch, growth, mature, decline), by brand or supplier, by margin tier, and by ad dependency. This lets you run targeted analyses: for example, pulling all 'mature' products with declining margins to identify candidates for price increases or ad cuts. Tools like Nova's Custom Breakdowns let you create and apply these tags across your entire catalog.
At scale, you can't optimize campaigns product by product. Instead, focus on portfolio-level metrics like TACoS (Total Advertising Cost of Sale) segmented by product group. Identify which segments have high organic sales ratios (meaning ads are less critical) and which depend heavily on sponsored placement. Use Winners and Losers analysis to catch products where ad spend is increasing but sales aren't following, then adjust budgets at the segment level rather than the keyword level.
Your review cadence should scale with your catalog size. For 100-200 ASINs, a weekly full review works. For 500+ ASINs, shift to a tiered approach: daily exception monitoring (stockouts, margin alerts, return spikes), weekly trend analysis on your top 50 products, and monthly deep dives on the full catalog with SKU rationalization decisions. The goal is spending 80% of your time on the 20% of products that drive results.
Consider removing a product when it meets three or more of these criteria: negative contribution margin for 3+ consecutive months, return rate above 15%, fewer than 10 units sold per month, and high ad dependency (TACoS above 25%) with no improvement trend. Before removing, check for parent ASIN halo effects, where a low-performing variant might be driving traffic to higher-margin siblings. Use a structured SKU rationalization process rather than making cut decisions in isolation.