Most sellers track at the SKU level and miss the bigger picture. Parent ASIN analytics rolls up revenue, ad spend, COGS, and returns to the product-family level so you can make better portfolio decisions.
Most sellers track performance at the SKU or Child ASIN level. They obsess over individual product margins while missing the bigger picture entirely. When you sell a t-shirt in 6 colors and 5 sizes, that's 30 separate P&L lines in Seller Central. You can't see whether the t-shirt as a product family actually makes money.
Parent ASIN analytics solves this. It rolls up every variant's revenue, ad spend, COGS, fees, and returns into a single line so you can make decisions about product families, not individual color-size combos. This guide explains the Parent/Child hierarchy, why grouping by Parent ASIN changes your decision-making, and how to set it up in under five minutes.
What Is a Parent ASIN on Amazon?
Definition
A Parent ASIN is a non-buyable Amazon identifier that groups related product variations (sizes, colors, styles, bundles) under a single listing. Customers see one product page with a variation picker. Behind the scenes, each selectable option is a separate Child ASIN with its own inventory, pricing, and performance data.
Think of the Parent ASIN as the product family umbrella. It doesn't have a price or stock level itself. Instead, it organizes the Child ASINs that customers actually buy. Every Child ASIN also maps to one or more SKUs in your P&L analytics, which is where things get complicated.
Level
What It Is
Buyable?
Example
Parent ASIN
Product family umbrella
No
B0PARENT01 (Cotton T-Shirt)
Child ASIN
Specific variation
Yes
B0CHILD001 (Blue, Medium)
SKU
Your internal identifier
Yes
TSHIRT-BLU-M-FBA
Amazon structures variation listings around variation themes: size, color, size-color, style, flavor, pattern, and others depending on the category. When a seller creates a listing with multiple options, Amazon assigns one Parent ASIN and one Child ASIN per unique combination.
When Amazon Merges or Splits Parents
Amazon can merge separate listings into a single Parent ASIN if it detects they're the same product. It can also split Parent ASINs after catalog quality reviews. Both actions happen without seller input and silently break your historical analytics unless you're tracking at the Parent level.
Why Child-Level Analytics Alone Fail
Seller Central reports everything at the Child ASIN or SKU level. That sounds granular and useful. In practice, it creates three serious problems for sellers with variation-heavy catalogs.
The Fragmentation Problem
One product in 4 sizes and 3 colors produces 12 Child ASINs. Each one has its own revenue line, its own fee structure, its own ad campaigns, and its own return rate. Your P&L dashboard shows 12 separate rows for what your customer perceives as a single product. Multiply that across 25 product families and you're staring at 200+ line items with no way to answer "which product family is actually profitable?"
Ad Spend Attribution Across Variants
Sponsored Products campaigns often target the Parent listing or one "hero" Child ASIN. The traffic benefits all variants through the variation picker, but ad spend attribution only shows on the targeted Child. Your TACoS calculations at the Child level are misleading because the ad spend on one variant drives sales across siblings.
Return Rate Distortion
In apparel, returns usually concentrate in a small number of sizes rather than spreading evenly across a family. At the Child level, that variant looks terrible. At the Parent level, the overall return rate can be perfectly healthy. Killing the "high return" variant could collapse the entire listing's ranking.
Worked example (illustrative, not a customer)
Take a kitchen-textiles catalog with 200 Child ASINs across 25 Parent ASINs. Ads run on one hero child per family at $400 a month, while the sales those ads generate land across all siblings. At Child level, the hero child carries the full $400 against only its own sales, so it prints a negative contribution while each sibling prints an artificially clean one.
Roll the same numbers up: family sales of $9,000, COGS and Amazon fees of $6,800, ads of $400, giving $1,800 of contribution. The arithmetic did not change, only the unit of analysis did. The family is profitable, and the child that looked like the loser is the one paying for the traffic.
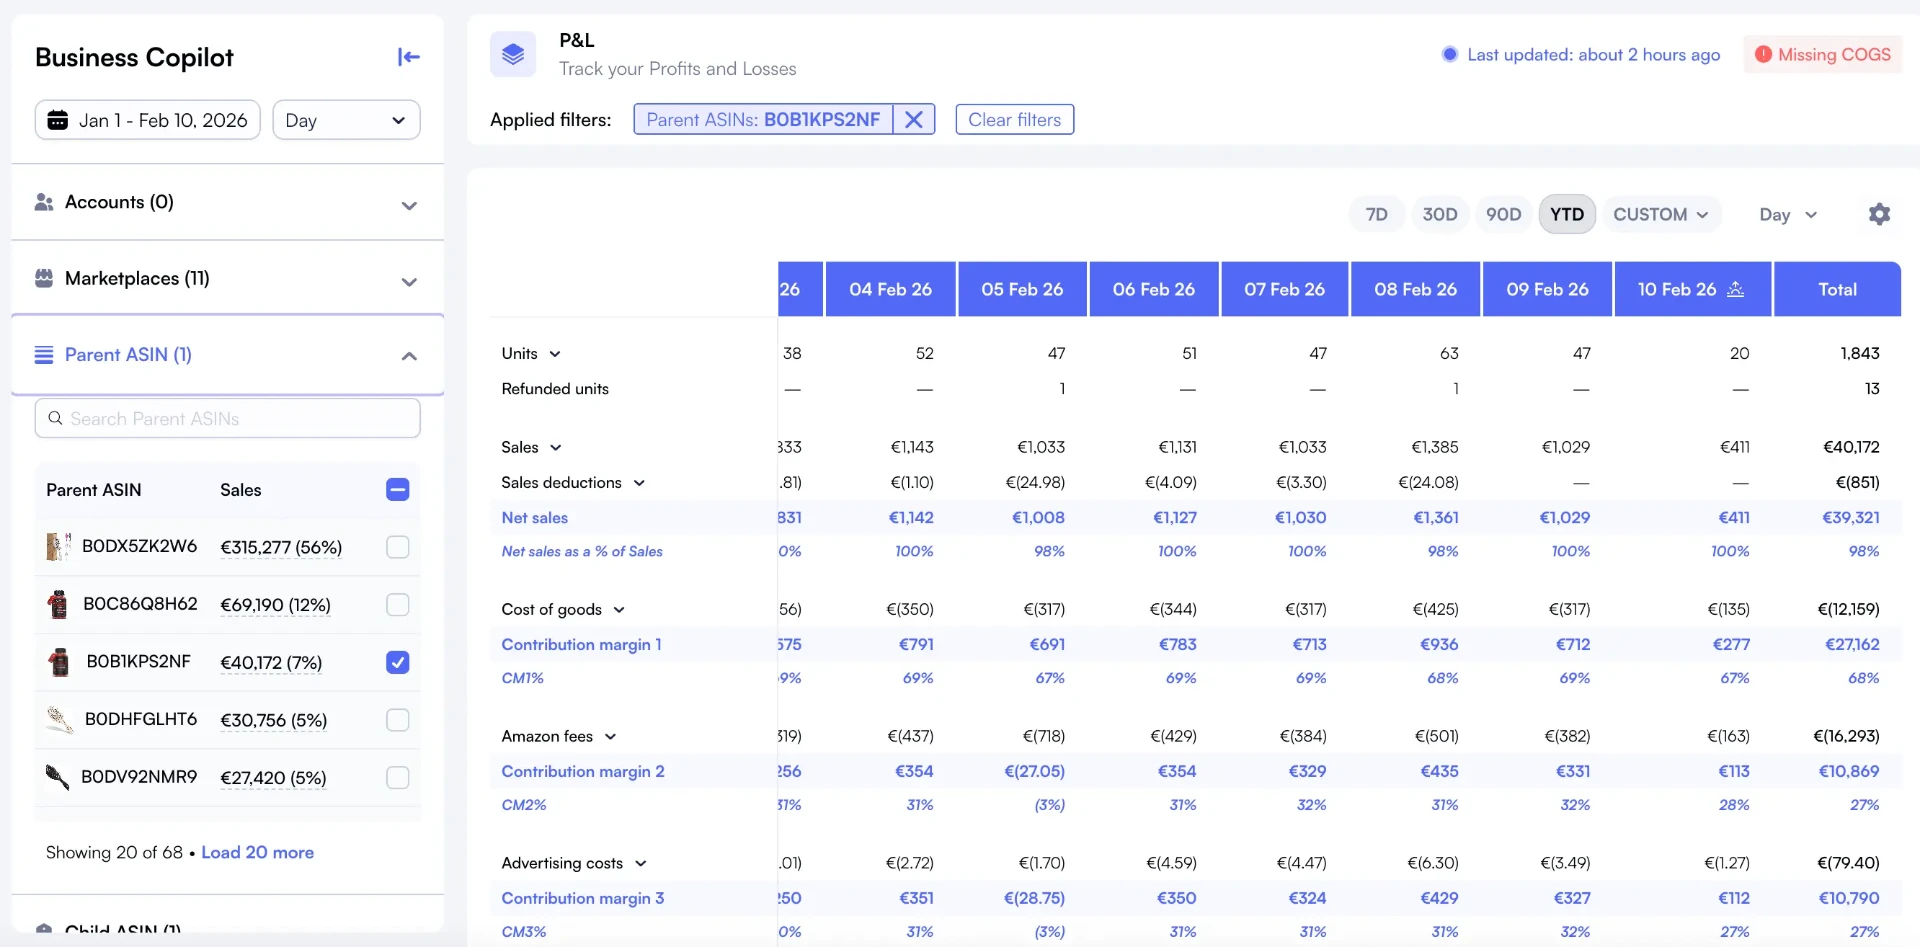
P&L drilled into a single Parent ASIN, showing the complete cost waterfall from Sales to CM3% with daily breakdowns. One view for the entire product family instead of dozens of variant rows.
Group by Parent ASIN: The Missing View
"Group by Parent ASIN" collapses all Child ASINs under their parent into a single aggregated row. Revenue, Amazon fees, FBA costs, COGS, advertising spend, and returns all roll up automatically. You see one line per product family instead of one line per variant.
This isn't just a visual convenience. It fundamentally changes which products look profitable and which don't. Here's what shifts:
Metric
Child-Level View
Parent ASIN View
Revenue
Scattered across 12 rows
Single total for the product family
Ad Spend
Shows only on targeted variant
Total ad investment for the family
TACoS
Inflated on hero variant, zero on siblings
True advertising efficiency per product
Return Rate
One variant looks terrible
Balanced view across all sizes/colors
Net Profit
Some variants negative, some positive
True product-family profitability
Decision
"Kill the blue medium variant"
"Keep the family, reallocate budget"
PPC spend attribution is the single biggest reason to adopt Parent ASIN grouping. Sponsored Products campaigns typically target one "hero" variant, but shoppers who land on your listing often purchase a different size or color through the variation picker. The ad spend stays attributed to the hero Child ASIN while the sale registers on a sibling. Only a Parent-level roll-up shows true ACOS and TACoS per product family. Without it, you're optimizing campaigns against incomplete data.
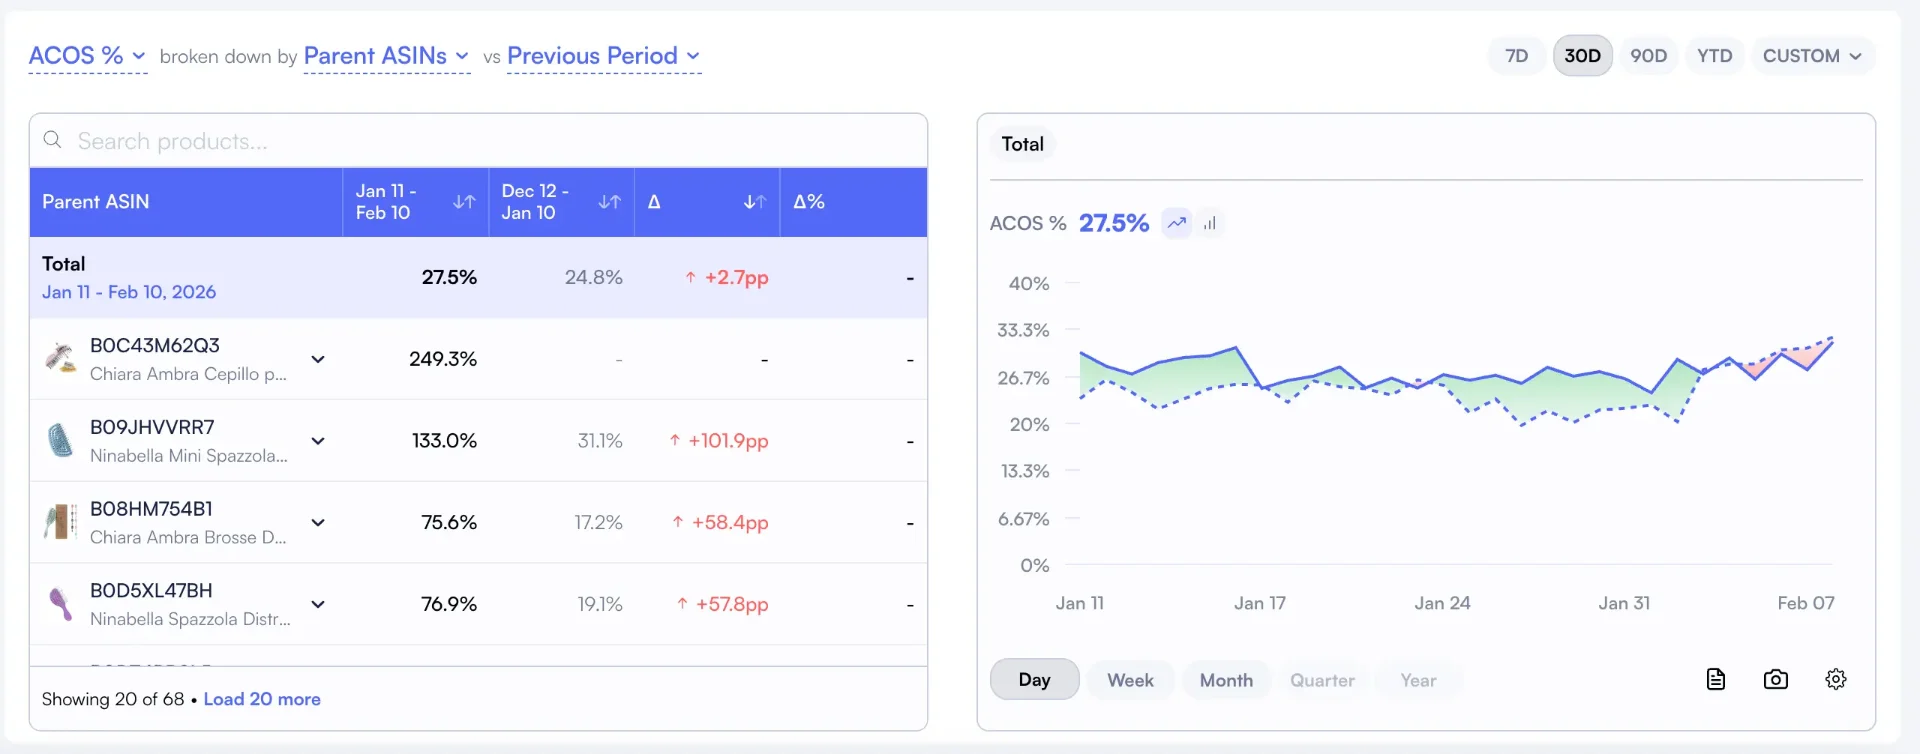
ACOS % broken down by Parent ASINs with period-over-period comparison. This view reveals which product families have ACOS trending up, enabling proactive budget reallocation before profitability erodes.
5 Decisions Parent ASIN Analytics Unlock
Once you can see performance at the product-family level, five types of decisions become dramatically clearer.
1. Kill or Keep Entire Product Families
Instead of agonizing over individual variants, you see the full picture. A product family generating $8K/month revenue with $1.2K net profit is a keeper. You don't need to worry that one color runs at breakeven when the family as a whole delivers.
2. Allocate Ad Budget Across Product Families
Shift your PPC budget allocation from individual SKUs to product families. If Family A returns 4:1 ROAS at the Parent level and Family B returns 1.5:1, the reallocation decision is obvious. Child-level data obscures this because ad spend clusters on hero variants.
3. Identify Which Variation Type Drives Profit
Does color matter more than size for your margins? Parent ASIN analytics combined with custom breakdowns reveals whether your "Navy" variants consistently outperform "Gray" across all product families, or if size "Large" carries the best margin everywhere.
4. Optimize Listing Content at the Parent Level
A+ Content, main images, and titles apply to the entire variation listing. When you know which product families drive the most revenue, you prioritize listing optimization and A/B testing for the families with the highest ROI potential.
5. Negotiate Supplier Pricing with Full Family Volume
Suppliers don't care about your individual SKU volumes. They care about total order quantity. When you can show that a product family moves 5,000 units/month across all variants, you negotiate from a much stronger position than quoting 400 units of one specific size-color combo.
How to Set Up Parent ASIN Tracking in Nova
Setting up Parent ASIN grouping takes less than a minute. There's no configuration, mapping, or data import needed. Nova automatically maps Child ASINs to their Parent using Amazon's catalog data.
3-Step Setup
Step 1: Connect your Amazon account to Nova. Parent/Child relationships are pulled automatically from the SP-API catalog data.
Step 2: Open any dashboard (P&L, Winners & Losers, Day-to-Day, or Custom Breakdowns) and click the dimension picker.
Step 3: Select "Group by Parent ASIN." All metrics instantly aggregate to the product-family level.
The grouping works across every analytical view in Nova. Your P&L shows one row per product family. Winners & Losers ranks your best and worst product families. Day-to-Day trends family-level metrics over time. You can switch between Child and Parent views with a single click.
You can also combine Parent ASIN grouping with other dimensions. For example, "Group by Parent ASIN + Brand Manager" lets an agency see which product families each team member manages and how they perform.
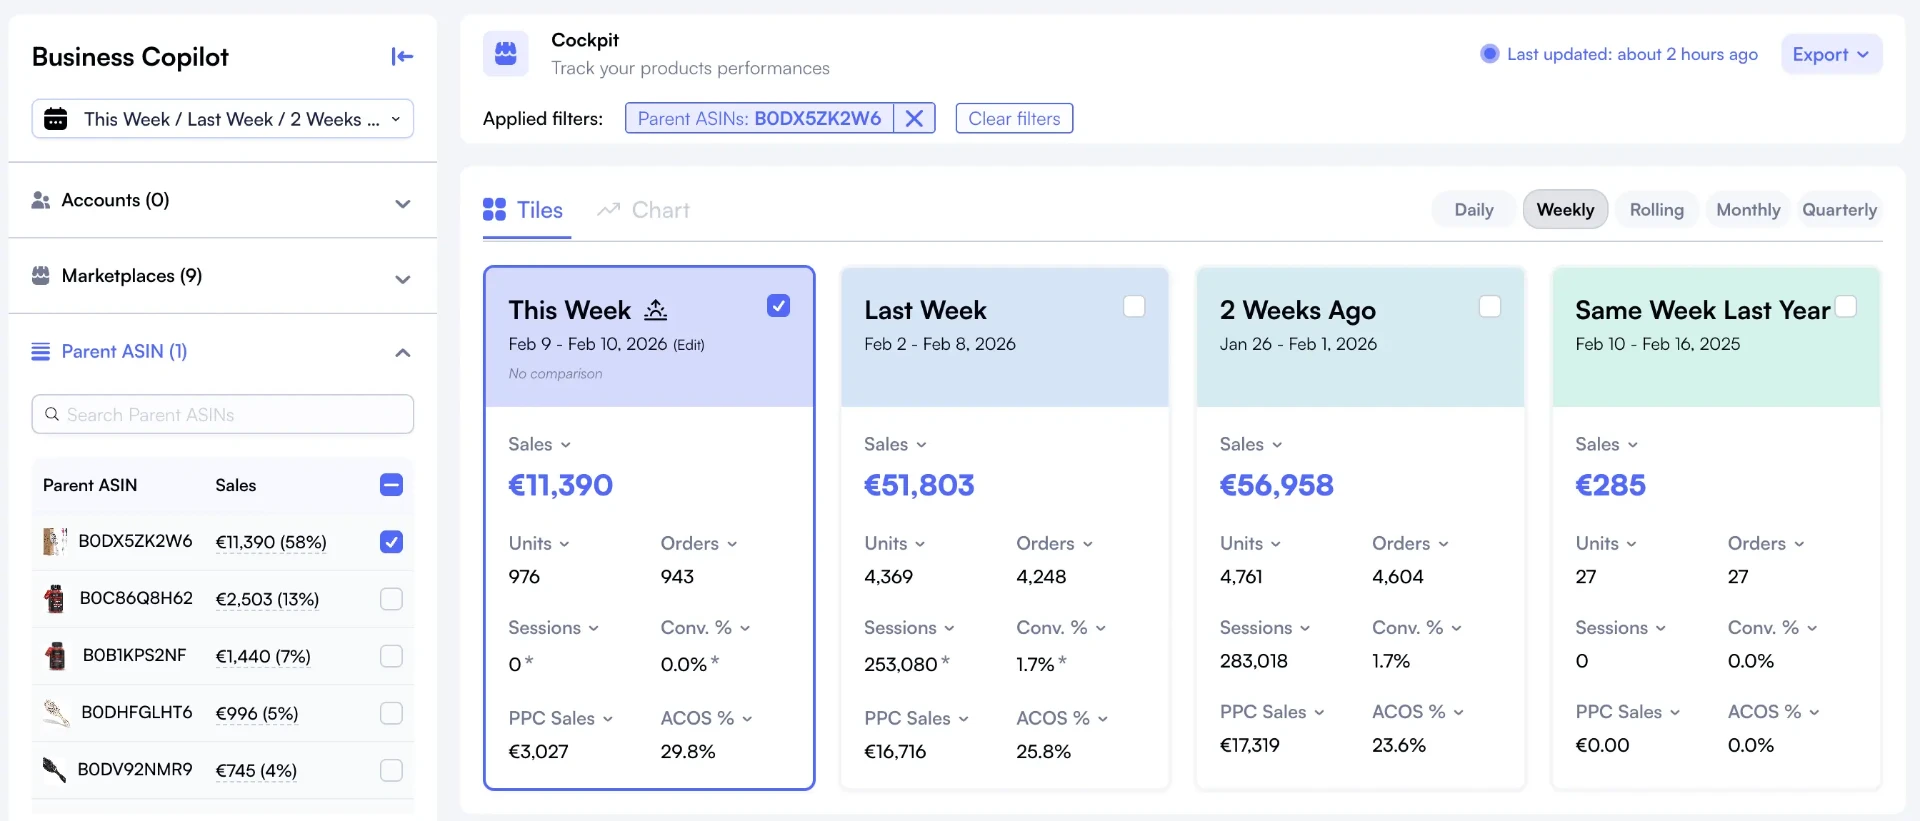
Cockpit filtered by Parent ASIN, comparing weekly PPC Sales and ACOS % across periods. Track advertising efficiency at the product-family level instead of chasing individual variant metrics.
Parent ASIN + Custom Breakdowns
The real power of Parent ASIN analytics emerges when you layer it with custom breakdowns. Nova lets you create custom dimensions like product lifecycle stage, supplier, brand manager, or price tier, and then cross-reference them with Parent ASIN grouping.
Consider an agency managing 10 brands, each with 20+ Parent ASINs. Without custom breakdowns, you're scrolling through 200+ product families trying to spot patterns. With breakdowns, you can answer questions like:
By lifecycle: which "mature" product families are declining? Which "launch" families need more ad investment?
By supplier: which supplier's products deliver the best contribution margins at the family level?
By brand manager: which team member's portfolio of product families is growing fastest?
By price tier: do premium product families ($40+) outperform budget families ($15-20) after all costs?
This combination of Parent ASIN grouping and product tagging gives you a multi-dimensional view of your catalog that's impossible to build in Seller Central or spreadsheets.
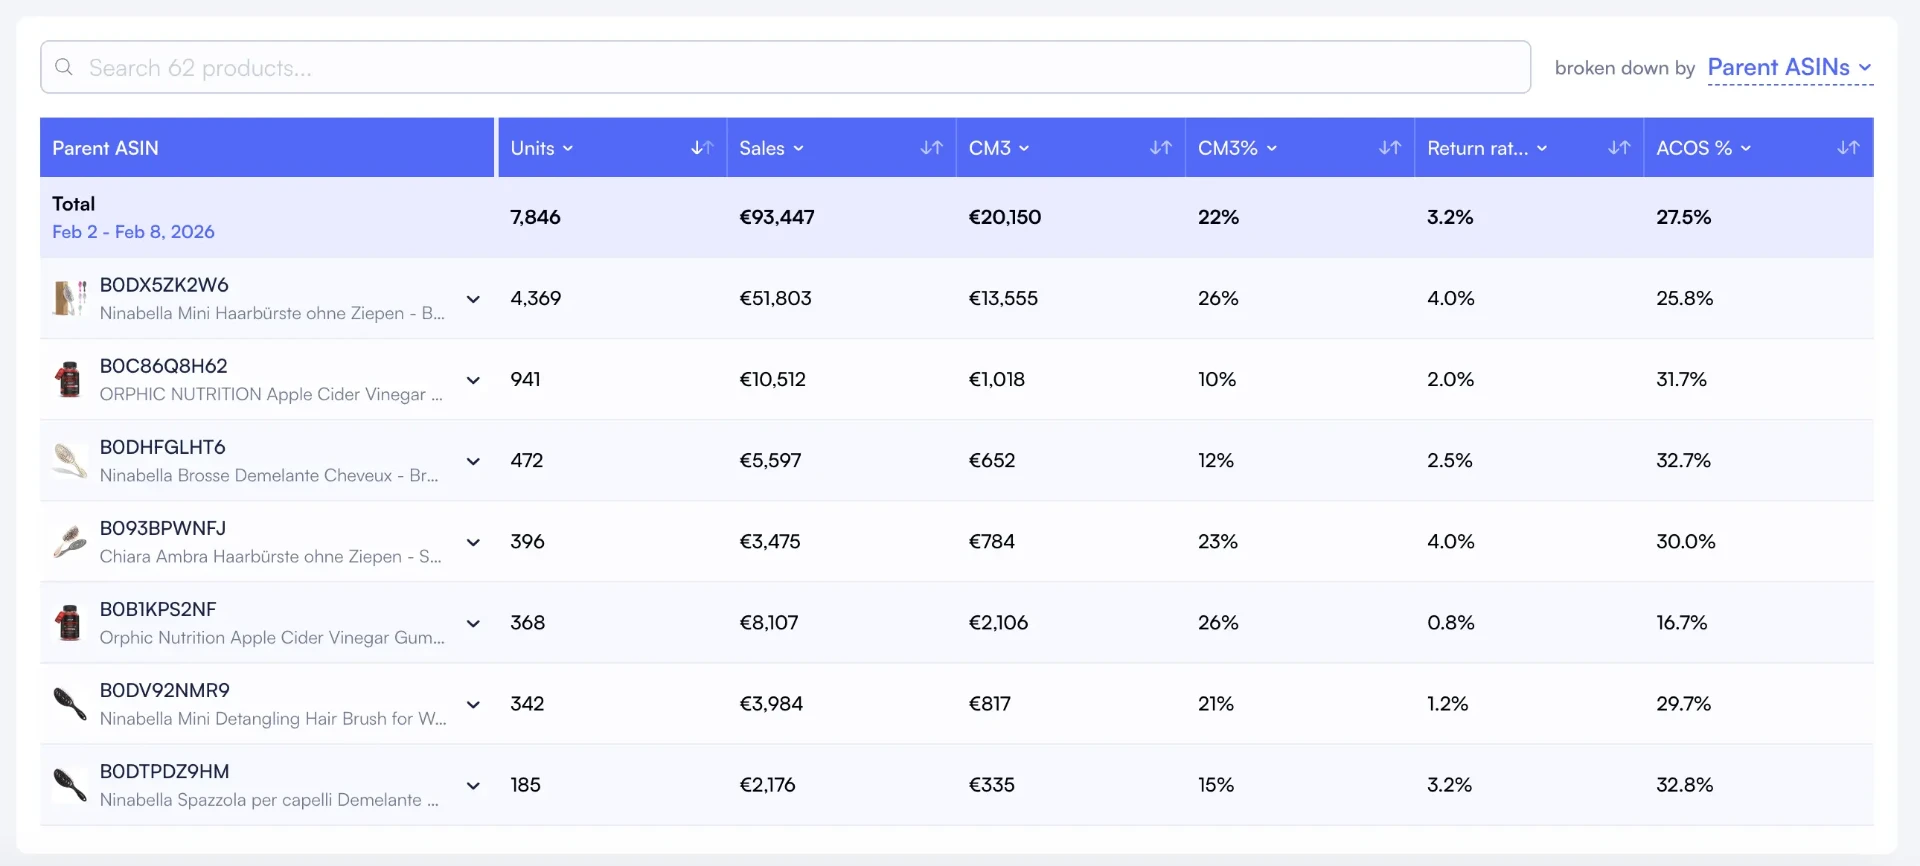
Portfolio broken down by Parent ASINs with CM3%, Return rate, and ACOS % in a single view. One row per product family instead of dozens of variants.
Common Parent ASIN Mistakes to Avoid
Mistake 1: Running PPC at Child Level Without Checking Parent-Level TACoS
You see a Child ASIN with 45% ACoS and pause it. But that variant was the traffic driver for the entire listing. Parent-level TACoS was a healthy 12%. Always check the family-level TACoS before making campaign changes.
Mistake 2: Killing a Variant That Drives Traffic to the Whole Listing
Amazon's algorithm considers the total sales velocity of a Parent ASIN for ranking. Removing a low-margin variant can tank the entire listing's organic rank, reducing sales across all remaining variants. Use Parent ASIN analytics to measure the full impact before discontinuing.
Mistake 3: Ignoring Merged Parent ASINs After Catalog Changes
Amazon periodically merges or splits Parent ASINs during catalog cleanup. If you don't monitor these changes, your historical comparisons break. A product family that "doubled revenue" might just be two families merged into one. Nova tracks these changes so your trend data stays accurate.
Mistake 4: Using Blended COGS Across Variants with Different Costs
A "Large" variant often costs 15-25% more to manufacture than a "Small." Using the same COGS for all variants inflates margin on large sizes and deflates it on small ones. Enter SKU-level COGS so your Parent ASIN roll-up reflects true costs.
Frequently Asked Questions
Common questions about Parent ASINs on Amazon
A Parent ASIN is a non-buyable identifier that groups related product variations (sizes, colors, styles) under a single listing. It acts as the umbrella for all Child ASINs, which are the actual purchasable products customers see.
Amazon allows up to 2,000 Child ASINs per Parent ASIN, though most listings have between 5 and 50. Apparel and home goods categories typically run 10-30 variants per parent.
No. Seller Central reports revenue, fees, and performance at the Child ASIN or SKU level only. There's no native way to aggregate profitability, ad spend, or returns to the Parent ASIN level. You need an analytics platform like Nova that supports 'Group by Parent ASIN.'
They refer to the same structure from different perspectives. A 'variation listing' is the customer-facing product page with dropdown selectors. The 'Parent ASIN' is the backend catalog identifier that binds all those options together.
In Seller Central, go to Inventory > Manage All Inventory and look for the 'parent' row above your variations. You can also find it in the Listing Quality Dashboard or by checking the 'Variation Relationships' section when editing a product.