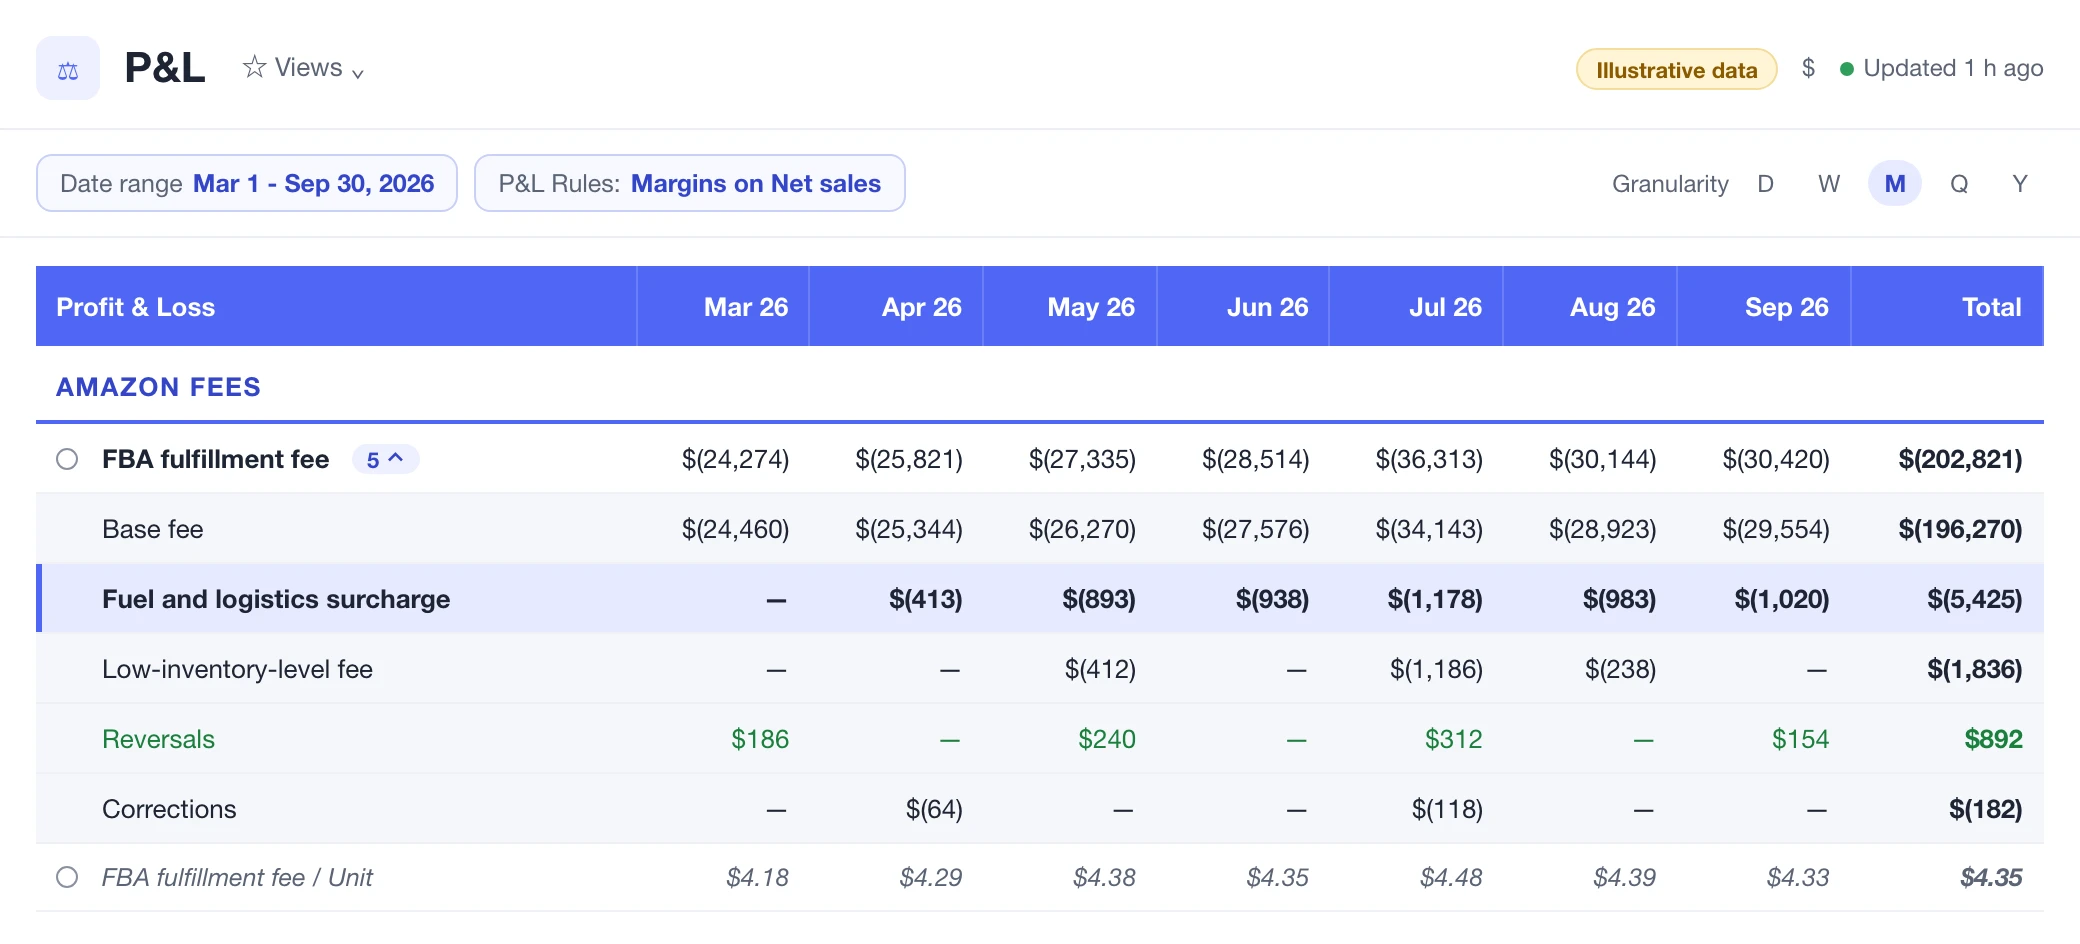
I opened a client's March Date Range Transaction report on a Sunday morning, half a coffee in, and saw $1,847 of low inventory level fees on three SKUs. Three. Not thirty. The brand had done nothing wrong on the operations side that week. Their PO had landed on time. Their forecast was right. They got hit anyway. That is the part nobody warns you about.
The fulfillment fee breakdown separates the base charge from surcharges and adjustments.
Amazon's FBA fulfillment fee schedule lists the low inventory level (LIL) fee as a stocking incentive. The way it actually behaves on a real P&L is closer to a structural tax on tight-cash sellers and on SKUs with lumpy demand. This guide walks through what the fee really is, how we have seen it land across roughly 40 Nova accounts in Q1 2026, why the official framing misses the point, and the five moves we would make this week if you are bleeding on it. I changed my mind on one of those moves twice while writing this, which is the honest part.
Key takeaway
The LIL fee is $0.89 to $1.10 per unit sold whenever your trailing days of supply drops under threshold (28 days, 35 in 2026 for some tiers). It compounds quickly. Three SKUs at 12 units a day, two weeks underwater, is about $560 to $920. Sellers we work with rarely lose 5 percent of net margin to it. They lose 0.5 to 1.5 percent, every month, quietly. See it inside Nova's P&L next to fulfillment and storage rather than discovering it in a settlement two weeks late.
What the LIL fee actually is
Plain math. Amazon checks your FBA units against a trailing demand signal. When the ratio implies fewer than the threshold days of cover on a standard-size SKU, every unit you sell from that point until you get back above threshold carries an extra $0.89 to $1.10 per unit. Some size tiers shifted to 35 days in 2026. The fee is line-itemed in Date Range Transaction reports as a low inventory level fee, separate from fulfillment.
A short worked example, since the help doc is light on those. SKU does 12 units a day. You have 240 units in FBA. That is 20 days of cover, well under the 28-day line. You ship 12 a day for the 11 days it takes your air-freight restock to be receivable. That is 132 units sold under threshold. At a midpoint of $0.99 per unit, the LIL fee for that single SKU over those 11 days is around $131. If your contribution margin per unit is $4, that fee took about 2.7 percent of the gross profit on those sales. Not catastrophic on one SKU. Multiply by a catalog with a few dozen tight-cover lines and you have what we saw on the client account that triggered this article.
Worth pinning down before we get into tactics: the fee applies to standard-size FBA only. Oversize, AWD, and FBM are out of scope. Marketplace Pulse has been tracking the wider Amazon fee creep for years and the LIL fee fits the pattern: small per-unit number, very large aggregate.
Why the official framing misses the point
Amazon's pitch is that LIL exists to keep buyers happy by reducing stockouts on fast movers. Fine on paper. Inside the P&L of a real seller, it is something else. It is a fee that disproportionately punishes the operators who can least afford it: brands with limited working capital, brands sourcing from Asia with 60+ day lead times, brands with seasonal demand, and brands launching new SKUs that have not yet earned the restock-limit headroom to maintain 35 days of cover.
Said another way. The seller with $2M of cash on hand keeps 60 days of cover on every SKU and never sees an LIL line on their P&L. The seller doing $80K a month with tight working capital keeps 21 days and pays LIL on most of their winners. The fee is structurally regressive. Stating that out loud helps because it changes the question. It is not "how do I avoid this fee." It is "how do I get to a position where I do not have to."
Field note, not a rule
Across the 40-ish Nova accounts I sampled for Q1 2026, the median LIL line on the P&L was 0.7 percent of net revenue. The worst account was 3.2 percent. The cleanest was zero. The difference between worst and cleanest was almost entirely cash. Not "operational excellence." Cash.
Why sellers actually get hit
When we dig into the LIL lines on a client P&L, the same five causes show up, in roughly this order of frequency:
Late inbound receive. Truck landed on Day 0 per the carrier scan. Amazon checked it in on Day 14. Your forward cover modeled the fast scenario. Reality picked the slow one. Use the carrier scan and check-in record to document the delay.
Restock-limit cap. Capacity Manager said no. You wanted to send 1,200 units, Amazon allowed 600. You bridged with what you had. You went under threshold. The fee landed.
Post-Q4 demand cliff that the trailing window missed. SKU sold 30 a day in December, you reordered on a 30-a-day pace, January normalized to 11 a day. Your January cover looked great. Your February cover, after a slow restock, did not.
Phantom velocity on a new launch. A first 14-day window of strong sales sets up your reorder math. Then the launch pad PPC tapers, organic does not catch, and the system thinks demand is higher than it is. You either overstock and pay aged-inventory surcharges later, or you trim and slip under LIL.
AWD timing gap. You moved bulk to AWD to avoid storage utilization charges. Replenishment from AWD to FBA took 9 days instead of 3. AWD units do not count toward LIL math. The fee triggered.
The pattern is uncomfortable: most of these are timing problems, not planning problems. A good operator following best practice gets hit on roughly the same cadence as a sloppy one, just on fewer SKUs. The cleanest way out is structural, not tactical, which we will get to in a minute.
How to calculate your real exposure
Most sellers we talk to know the fee exists. Very few can tell us, on the spot, what it cost them last month. The check takes 10 minutes. Pull a Date Range Transaction report for the last 30 days. Filter on the fee description for "low inventory level." Sum it. Divide by net revenue for the same window. That number is your monthly LIL drag.
If you want it at the SKU level rather than account level, you will need to join the transaction-level data to your ASIN dimension table. That is annoying in a spreadsheet and trivial inside Nova. Either way, the rule of thumb after running this with dozens of operators: anything above 0.5 percent of net revenue is worth a meeting. Anything above 1.5 percent is a working-capital problem, not an ops problem, and you should treat it as one.
Healthy band
< 0.5%
LIL fee as a share of net revenue. Leave it alone, monitor monthly.
Yellow band
0.5 to 1.5%
Worth a tactical fix. Usually 3 to 5 SKUs are doing most of the damage.
Red band
> 1.5%
Working-capital problem. Tactics will not fix this. See moves 4 and 5 below.
Benchmark caveat. These bands come from the Q1 2026 sample of Nova accounts noted above. Your category may run hotter (apparel, supplements) or cooler (oversize, slow-turn niches). Use them as a starting point, not a verdict. Practical Ecommerce has covered the broader fee-hike pressure and the sellers most exposed.
What we would do this week
In rough order of cash impact per hour of effort.
Identify the 80/20. Run the SKU-level breakdown above. In almost every account we have looked at, 3 to 8 SKUs drive 60 to 80 percent of the LIL spend. Fixing those is a different conversation than fixing the catalog.
Move reorder triggers up by one lead-time cycle. Not by a fixed number of days. By a cycle. If your Asia lead time runs 45 days, set reorder at 45 + 35 = 80 days of cover, not the textbook 60. This is the tactic I almost did not include because it sounds like "just hold more inventory." It is not. It is "stop pretending your lead time is the average instead of the long tail."
Use FBA on top SKUs, AWD for the rest. The classic move. Keep your 3 to 8 high-velocity SKUs at 45+ days of FBA cover. Move depth on the slower tail to AWD where it does not pay storage utilization. This is also where I changed my mind. We used to recommend pushing more to AWD by default. After watching the AWD-to-FBA replenishment lag on a few accounts, the answer is more selective: AWD for tail, fast direct-to-FBA for winners.
Negotiate net 60 with your supplier. The fee is fundamentally a working-capital tax. Any move that buys you 30 days on the payable side gives you 30 days of extra cover on the inventory side without touching cash on hand. We have seen sellers cut LIL spend by half doing only this.
Stop launching SKUs with phantom-velocity reorder math. For new launches, ignore the first 14-day sales window for reorder planning. Use a 30-day window or a category-typical curve. Do not base the reorder plan only on the first two weeks.
Nova surfaces the LIL fee at the SKU level inside the P&L, alongside 40+ other Amazon fee types, alongside real-time sales data. The FBA inventory management view flags SKUs within 7 days of dropping under threshold so you can act before the fee triggers, and the full FBA analytics workspace ties LIL exposure back to net margin per SKU, per marketplace, per account. Across 700+ metrics and 23 marketplaces, starting at $49/mo. For agency setups, see Nova for agencies; for in-house teams, Nova for FBA sellers.
Frequently asked questions
It is a per-unit fee Amazon charges on standard-size FBA SKUs when your historical days of supply falls below the threshold (28 days in 2024-2025, raised to 35 days for some tiers in 2026). The fee ranges from roughly $0.89 to $1.10 per unit sold while you are below threshold, and it applies on top of the normal FBA fulfillment fee.
Amazon looks at units in FBA divided by a trailing demand average, then evaluates that against your forward demand signal. The exact window has moved a couple of times since launch. In practice your safest mental model is: keep at least 35 days of cover on any SKU doing more than 100 units per month, and check the official Amazon FBA fulfillment fee schedule once a quarter.
No. It only applies to standard-size units fulfilled through FBA. FBM units are out of scope. Inventory held in Amazon Warehousing and Distribution does not count toward your FBA days of supply, so AWD stock does not save you from the fee, and it also does not trigger it. You only get credit for what is in the FBA network.
Sometimes. When disputing a fee, document any inbound-shipment delay, promotion-related demand change, or service outage that affected the calculation. File via the Help case path, include the inbound shipment ID and the daily snapshot of available units, and expect a 2 to 4 week turnaround.
Nova surfaces the fee per SKU in the same P&L row as fulfillment, storage, and aged-inventory surcharges, with fee data from hourly Amazon finance transactions. You see which units are bleeding now, which SKUs are within 7 days of dropping under threshold, and what the rolling 30-day LIL spend has done to net margin. The Days of Inventory view flags red and amber zones before Amazon's billing run.